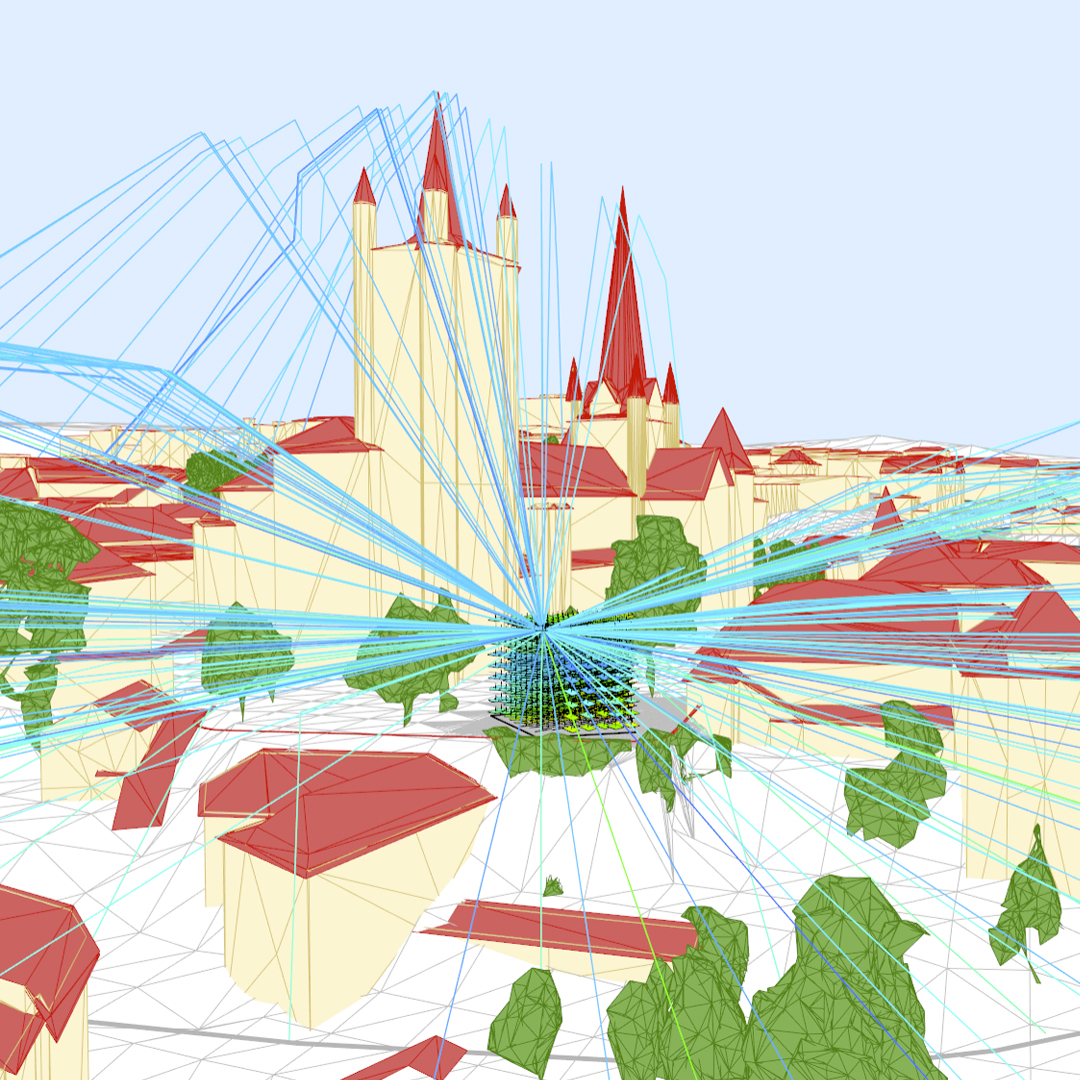
Site Analysis
Sun, views, noise and wind are resources of primary importance to create healthy and sustainable cities. They define how people experience urban space and how buildings perform, specifically in increasingly denser urban settings. With UrbanMetrix these complex environmental phenomena become visible, simple, and fast to handle. Given a site location and size, the tool gathers the necessary geodata and discretizes the site into a volumetric grid of sensor points running all environmental simulation without the necessity for the user to provide additional inputs.
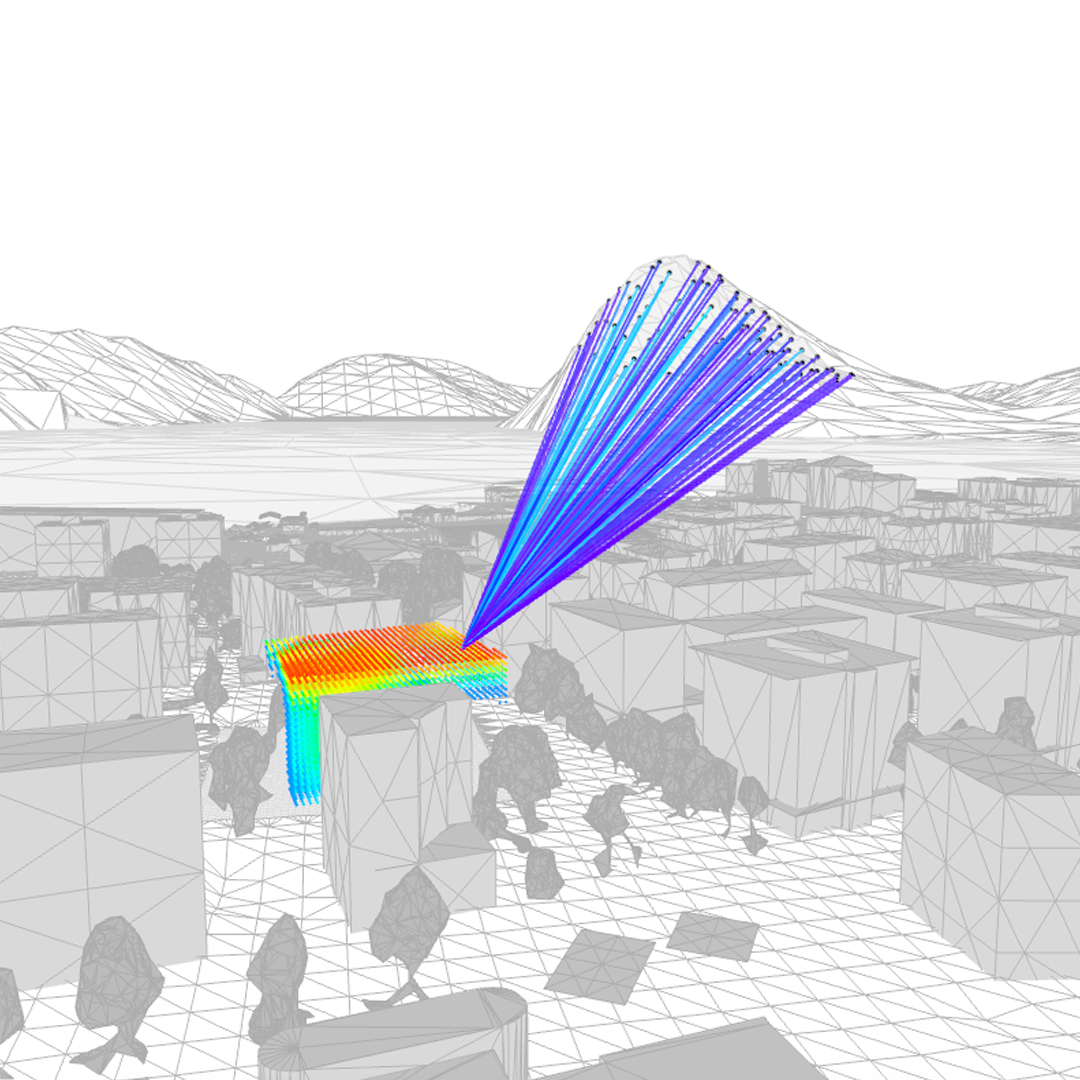
Views
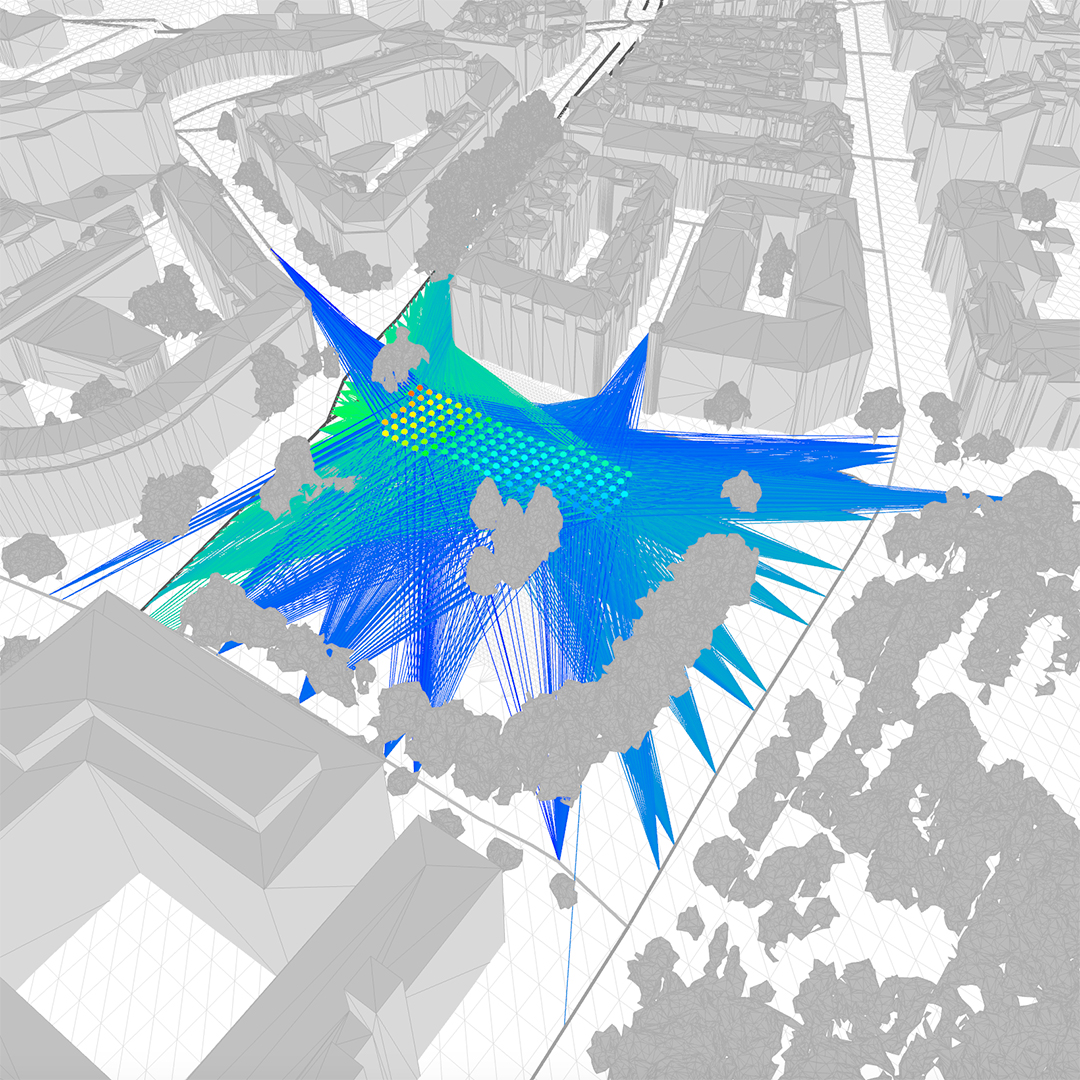
Noise
Early Design
The generated environmental data can then be visualized, filtered, and combined through a highly interactive interface. Results can then be quickly transformed into schematic three-dimensional suggestions. These design schemes enclose the logic of a specific environmental intention related to the achievement of a design goal. Thresholds and weights can be interactively adjusted to influence the results according to the specific aims of the user. These 3D suggestions can be related to outdoor spaces, building massing, facade design, or to the design of components such as PV panels, openings, balconies, and shadings.
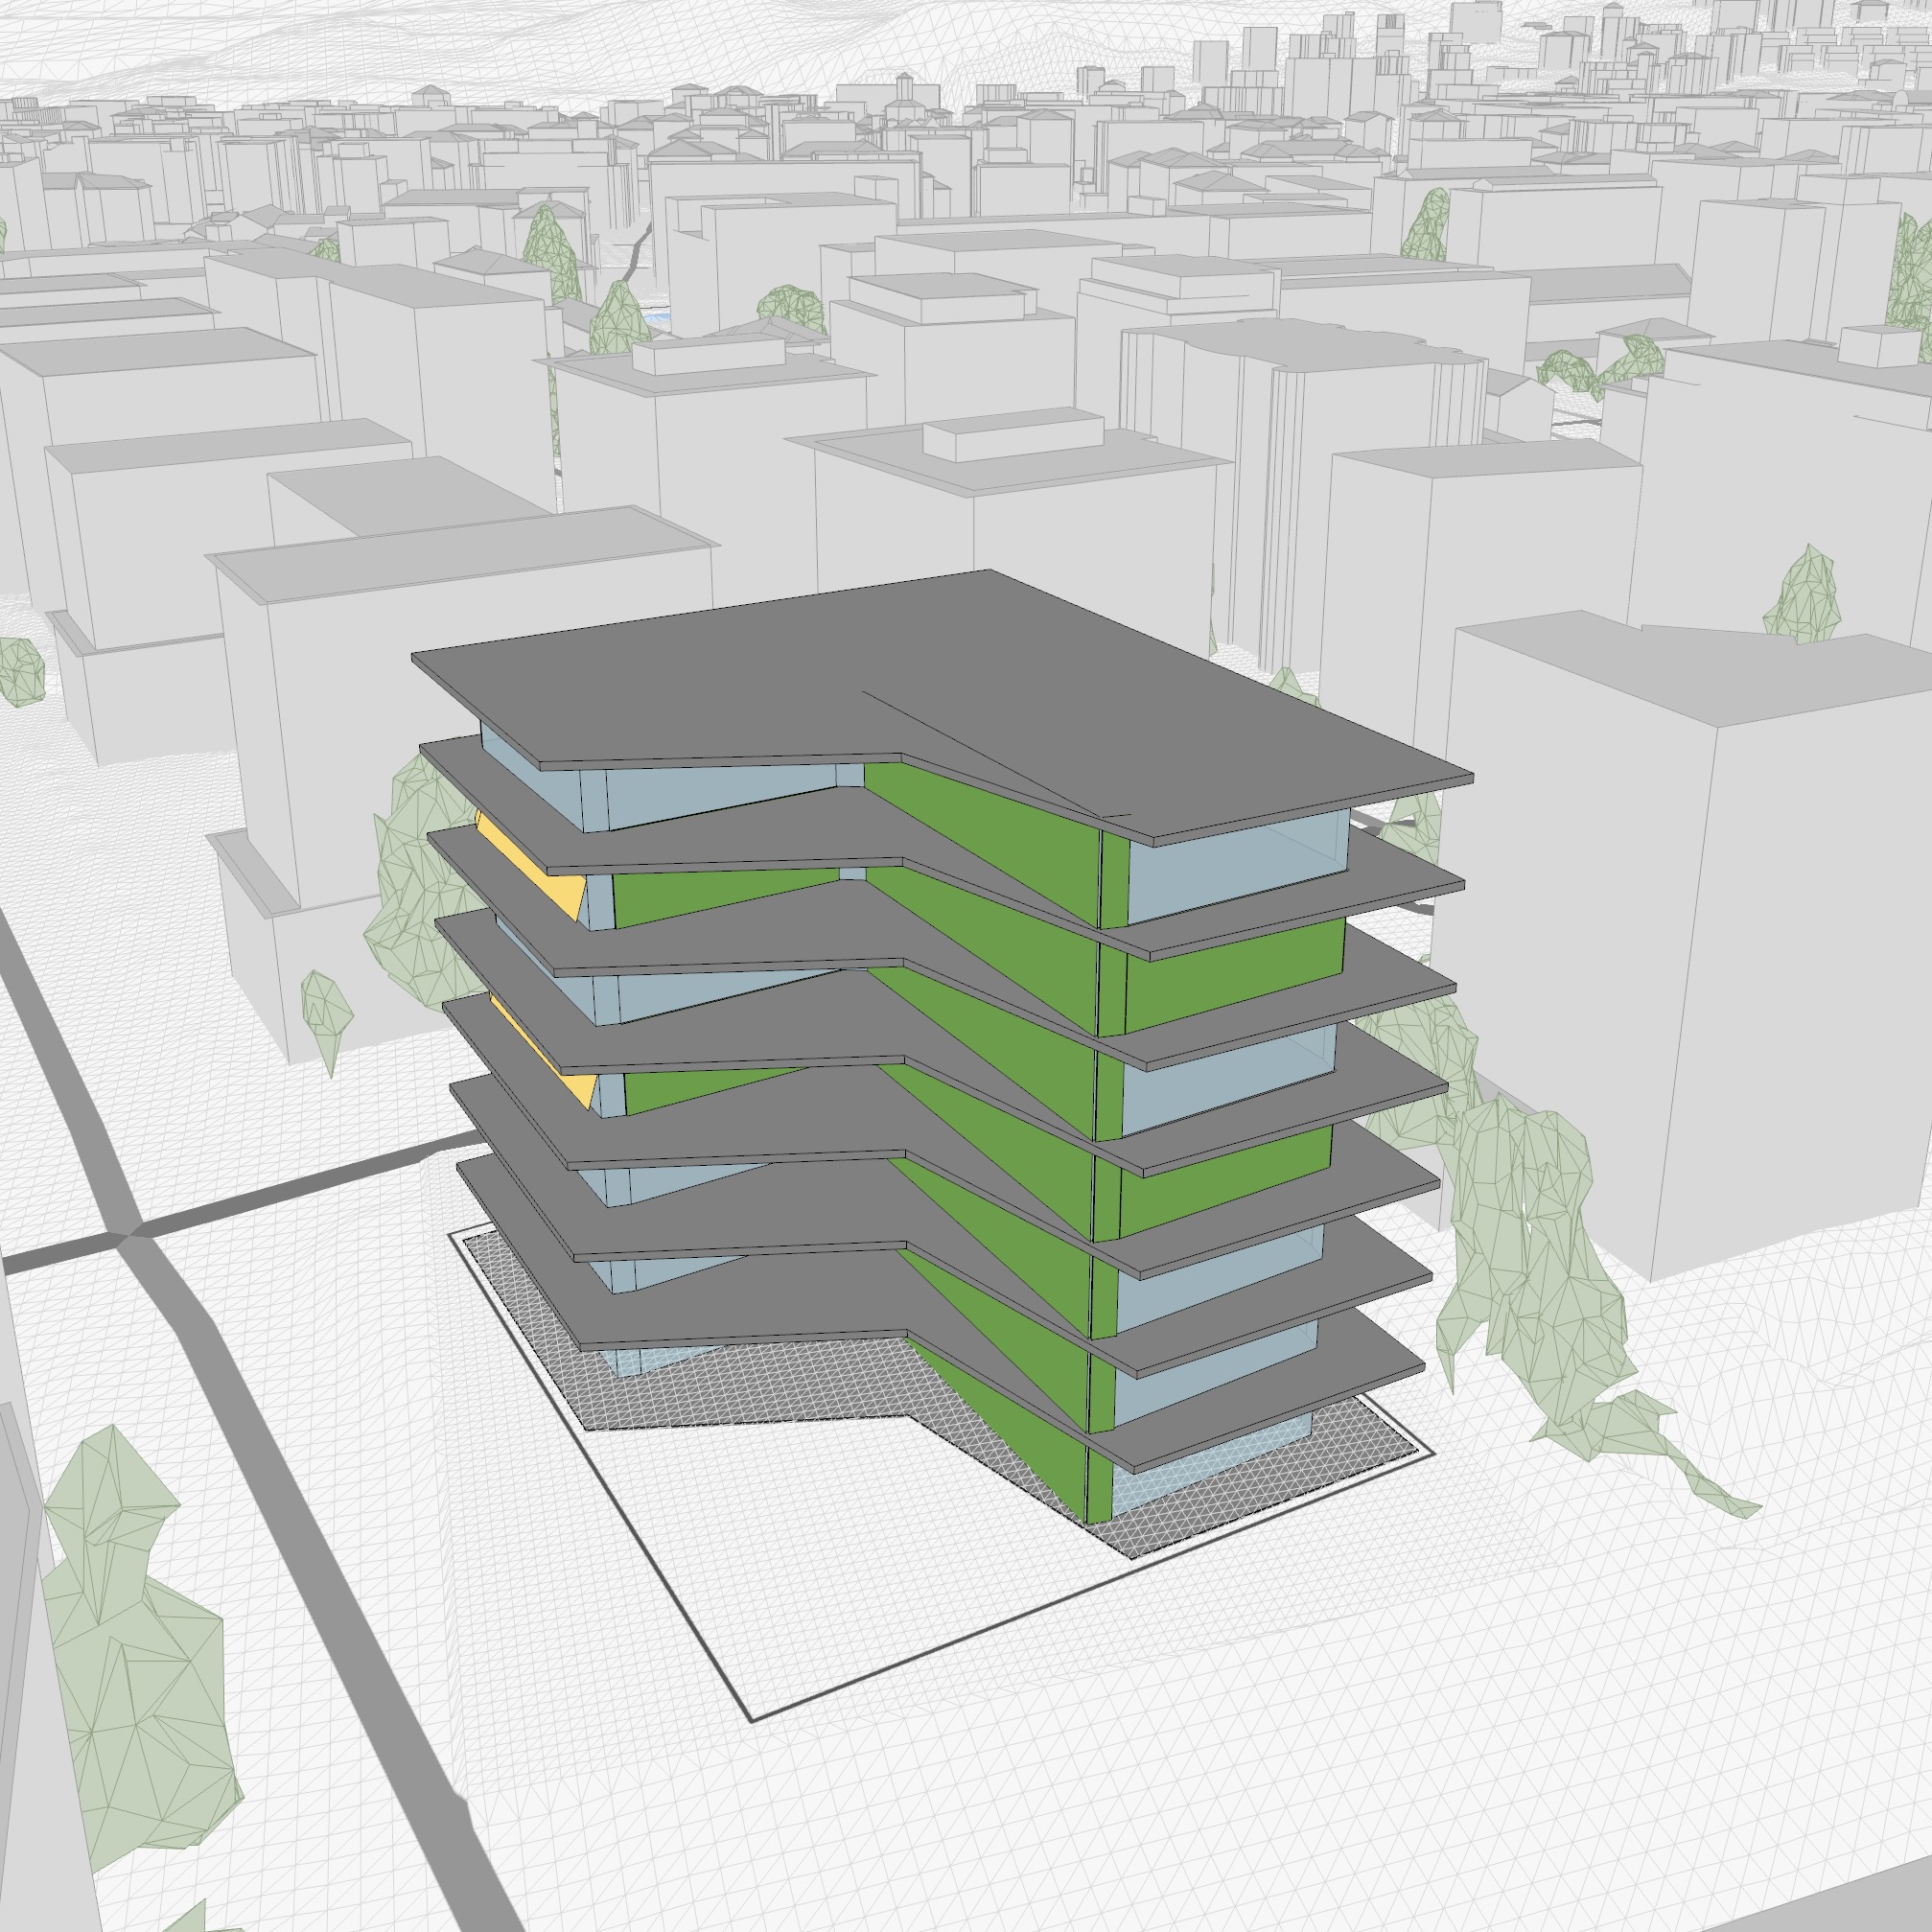
Facade design
Use Cases
UrbanMetrix can be used to created value in different type of projects such as new constructions, renovations, and external spaces, and also at different scales spanning from single-family houses, urban buildings, tall towers, and neighborhoods, to large urban areas. It can also be used for different purposes going from the definition of high-level decisions and strategies, down to the detailed design of building components.
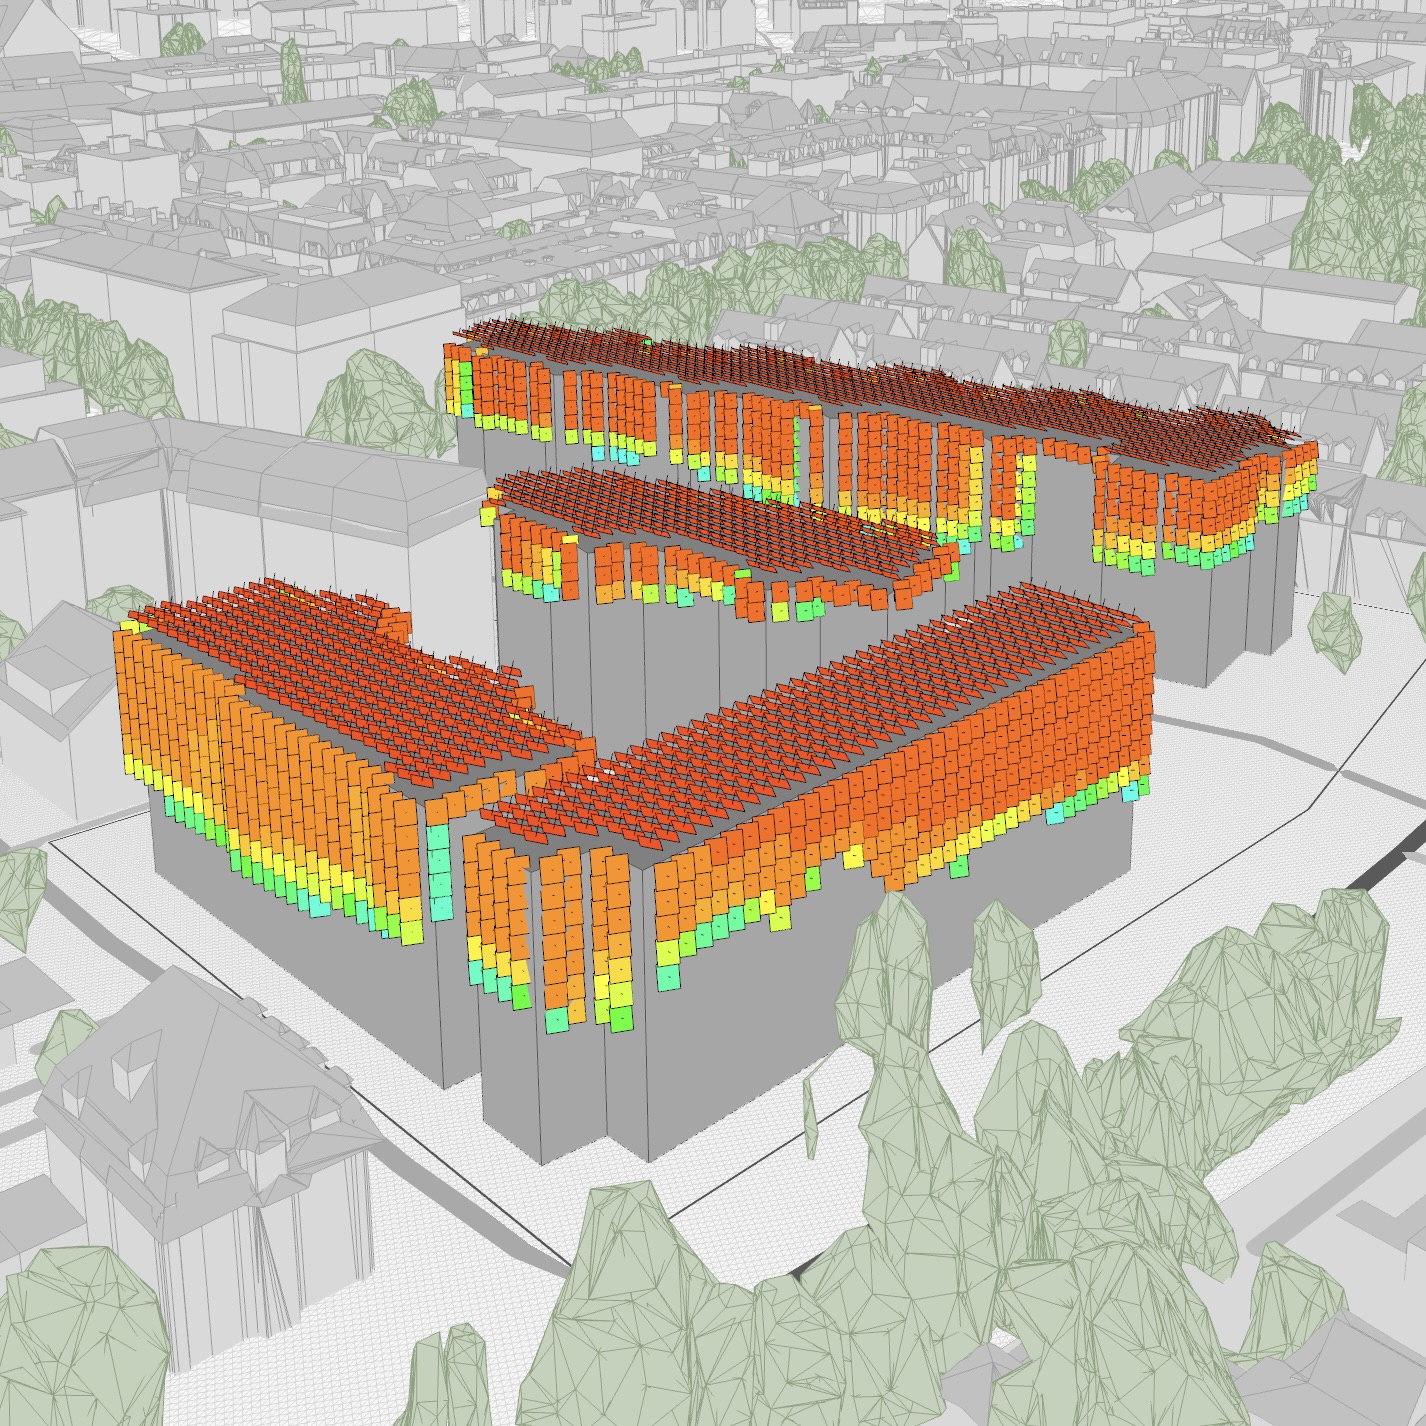
Renovation of neighborhoods
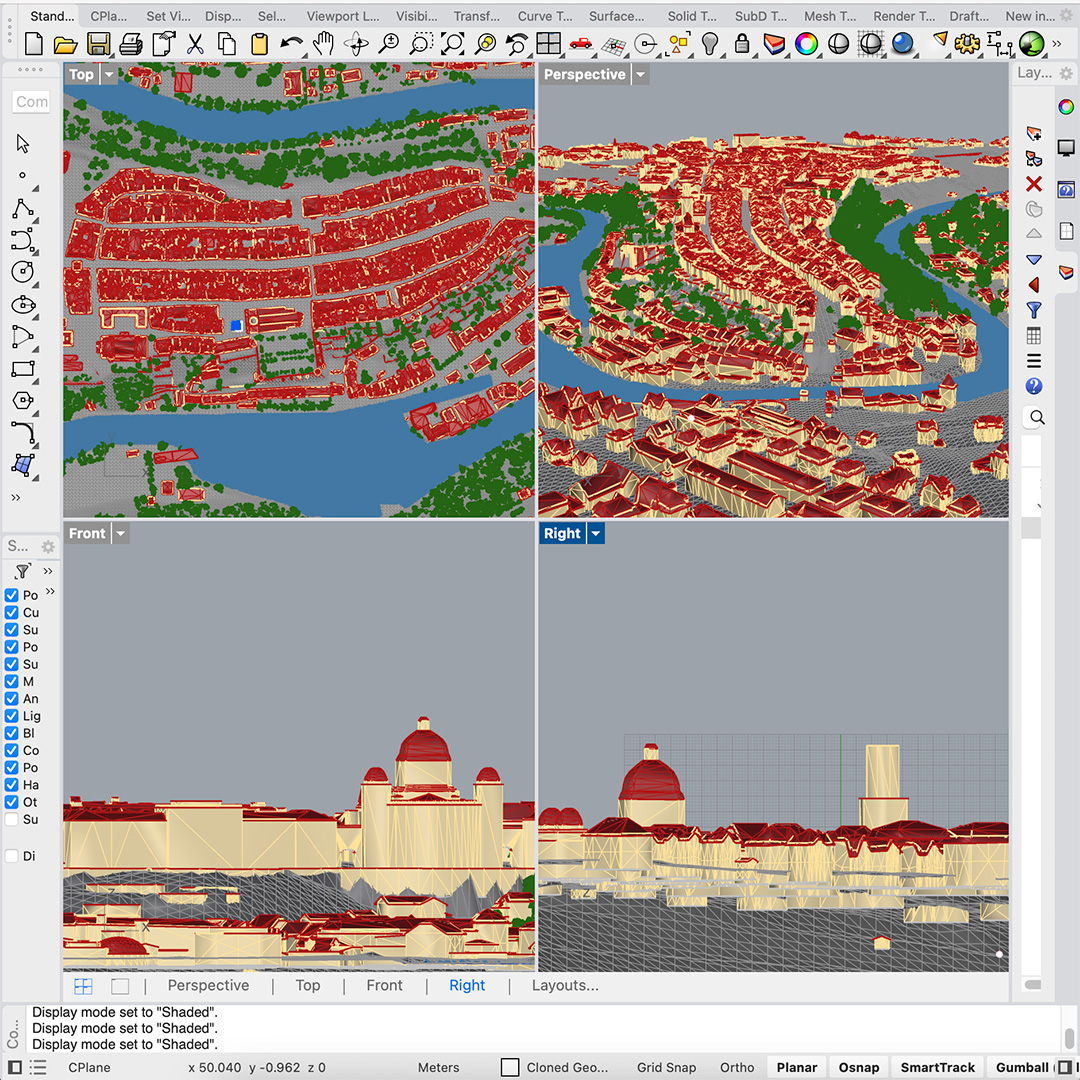
Workflow
UrbanMetrix is a web-application that combines a user-friendly interface and an intuitive 3D visualizer. The interface allows you to gather geodata, to upload your own 3D models, and to monitor cloud-based simulation processes. After a few minutes you can then observe the results in the 3D Visualizer and transform complex data into clear 3D solutions that anticipate environmental performances. The resulting 3D models can be easily exported to existing 3D modelers feeding the decision and design process with a new form of environmental intelligence.
Interactive visualizer
Workflow integration
Testimonial

“The testimonial quote... Lorem ipsum dolor sit amet, consetetur sadipscing elitr, sed diam nonumy eirmod tempor invidunt ut labore et dolore magna aliquyam erat, sed diam voluptua. Lorem ipsum dolor sit amet, consetetur sadipscing elitr, sed diam nonumy.”
“The testimonial quote... Lorem ipsum dolor sit amet, consetetur sadipscing elitr, sed diam nonumy eirmod tempor invidunt ut labore et dolore magna aliquyam erat, sed diam voluptua. Lorem ipsum dolor sit amet, consetetur sadipscing elitr, sed diam nonumy.”
“The testimonial quote... Lorem ipsum dolor sit amet, consetetur sadipscing elitr, sed diam nonumy eirmod tempor invidunt ut labore et dolore magna aliquyam erat, sed diam voluptua. Lorem ipsum dolor sit amet, consetetur sadipscing elitr, sed diam nonumy.”
“The testimonial quote... Lorem ipsum dolor sit amet, consetetur sadipscing elitr, sed diam nonumy eirmod tempor invidunt ut labore et dolore magna aliquyam erat, sed diam voluptua. Lorem ipsum dolor sit amet, consetetur sadipscing elitr, sed diam nonumy.”