Use this section of the Visualizer to customize how data is represented in the 3D scene:
-
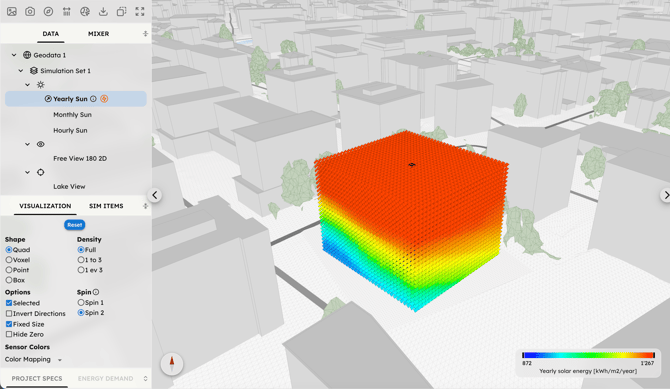
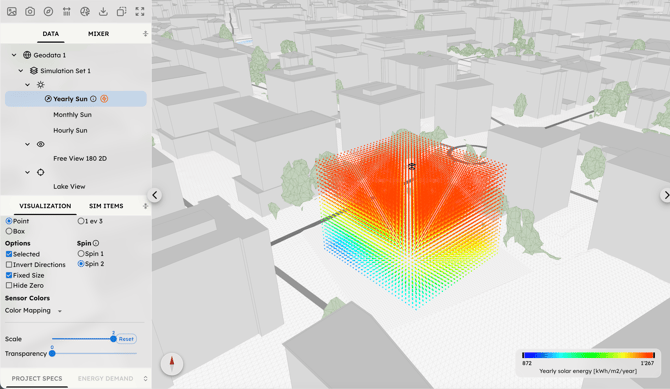
Shape: Choose the geometry of the sensor points between Quad, Voxel, Point, or Box.
-
Density: Adjust the number of visible points (Full, 1 to 3, or 1 every 3).
-
Spin: Choose the mathematical method for the 3D rotation of the sensor points:
-
Spin 1: single rotation around a single 3D axis.
-
Spin 2: combination of two rotations (horizontal orientation and vertical tilt).
The selected method will change the physical alignment of your Quads or Boxes, helping you better interpret the directional flow of the analysis.
-
-
Appearance: Define the Direction, Size, Scale, and Transparency of the sensor points for optimal clarity.