Select which analyses to run in your Simulation Set and configure their parameters. Sun, Free-View, Target-View, Noise, and Wind are all included by default.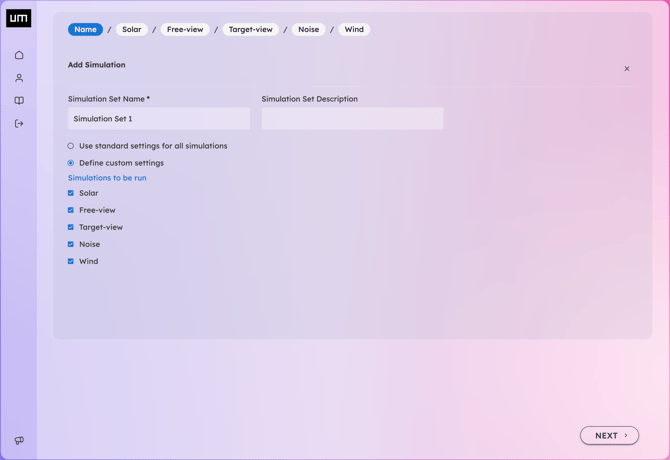
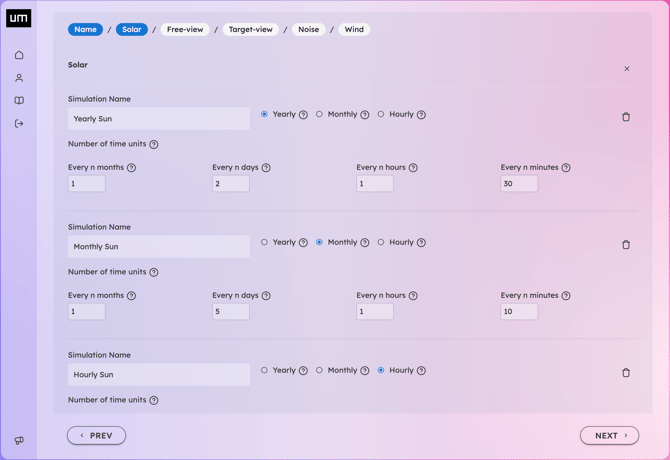
Sun
Yearly, Monthly, and Hourly simulations for both Sun Time and Solar Energy are run by default. Parameters typically only require adjustment for specific cases.
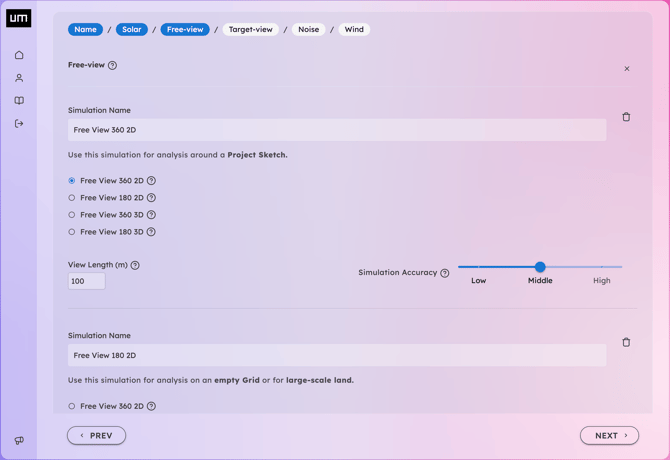
Free View
In Free-View simulations, the open space surrounding a Sensor Point is quantified as a fraction of a visible area or volume. You can utilize circles or spherical sectors for this purpose. The Free-View Length should be set based on the distance of existing obstructions or your specific research goals. Use shorter distances (e.g., tens or hundreds of meters) to investigate close-range urban space, or longer distances (e.g., hundreds of meters or kilometers) to evaluate horizon openness. Results will have absolute values, but presented in relation to the maximum free distance.. If you see that around your site the relevant highest urban glimpses have a depth of 300m, then 300m may be a good choice. While 30 km is ideal for long-range horizon analysis, 100m is set as the default value as, according to references, spatial perception of 3D depth often becomes less accurate beyond this threshold. Use Free View 360 simulation for analysis around a Project Sketch, Free View 180 for analysis on an empty Grid or for large-scale land.
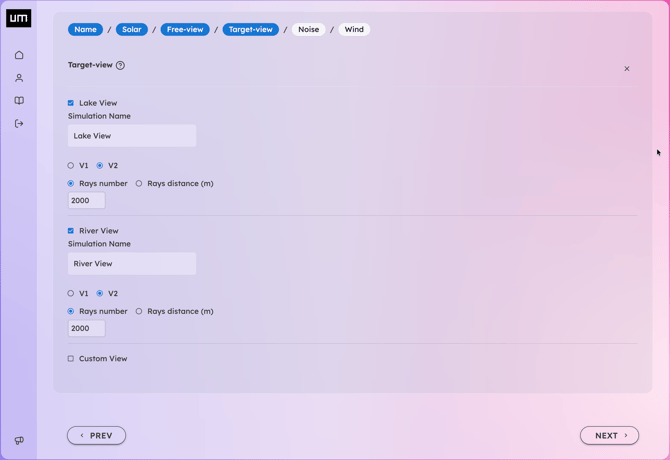
Target View
Select which areas of interest to consider for the Target-View simulation. You can create various combinations of the custom polygons defined in your Geodata (e.g., Mountain 1, Mountain 2, or a combined Mountain 1 + 2) to analyze specific visual impacts. For each target, you can set the number of rays or the spacing between them; adjusting these parameters will increase or decrease the density of the lines displayed in the visualizer.
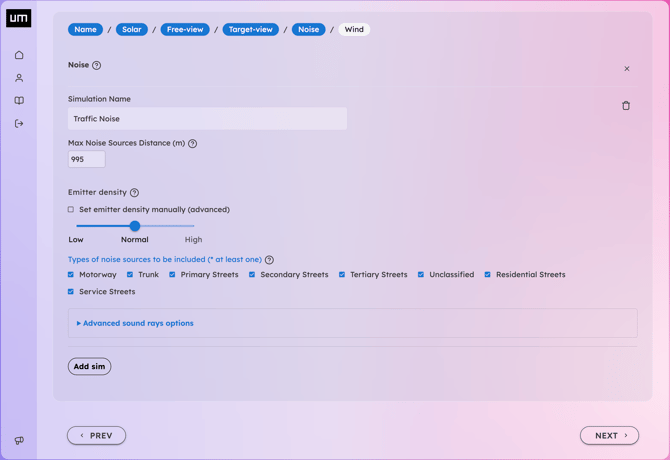
Noise
Select the road categories to include in the traffic noise simulation. To preview road categories around your site, visit OpenStreetMap, search for your location, right-click on a street, and select Query features.
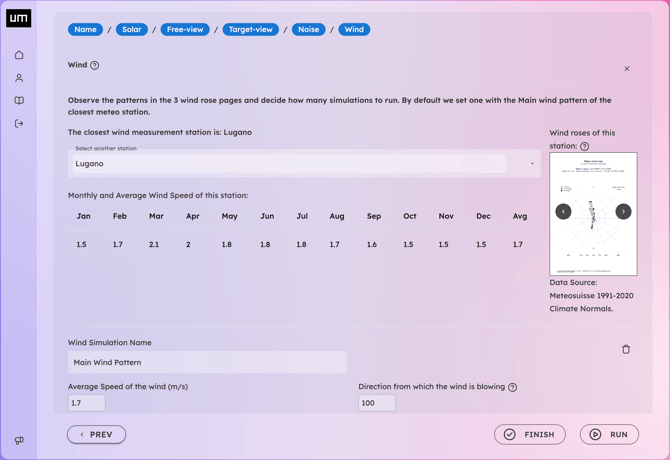
Wind
UrbanMetrix provides wind data from the nearest MeteoSwiss measurement station. Review the yearly, seasonal, and monthly wind roses to determine the number of simulations needed based on relevant patterns (e.g., winter and summer winds). Default parameters are based on the primary wind pattern.
If the nearest MeteoSwiss station is far away or separated by significant obstructions (like a mountain), we recommend sourcing data from a more local meteorological station to refine the simulation input.
Depending on the complexity of the datasets, your simulations may require a few minutes to process.
You can open the 3D Visualizer and view results as soon as an individual simulation status is marked as complete. You do not need to wait for the entire set to finish.
Simply refresh the page or reopen the Visualizer to load additional simulations once their status updates to ready.