
To maximize the efficiency of a sustainable urban project, the goal is to align the supply of solar energy with the actual energy demand of the buildings.
By understanding when a building consumes the most energy throughout the year and the day, you can utilize UrbanMetrix to optimize the placement of new buildings on the site, or refine existing building surfaces by placing window openings (for Solar Heat Gains) and photovoltaic (PV) panels exactly where and when they are needed most.
Understanding Energy Demand Peaks
Energy consumption behaviors change depending on the building's target use. Standardized engineering benchmarks, such as the Swiss SIA 2024 guidelines (Standard User Conditions for Energy and Building Services), highlight distinct peak patterns:
Commercial & Office Buildings
- Yearly Peak: January. This represents the coldest and darkest month of the year, demanding massive amounts of energy for space heating and electrical operations.
- Daily Peaks: Office spaces experience two primary consumption surges: a late morning peak and an early afternoon peak, directly matching core operational and working hours.
Residential Buildings
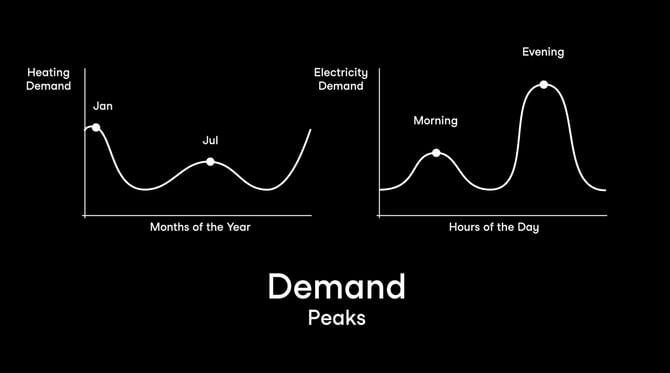
- Yearly Peak: January. Similar to commercial patterns, heating demands are high during mid-winter.
- Daily Peaks: Residential units show a two-peak profile: early morning peak, a brief surge before residents leave for work or school, and a dominant evening peak, the main daily peak occurs in the late afternoon/evening (typically between 17:00 and 21:00), when residents return home, turning on appliances, lighting, and HVAC systems.
Scenario 1: Optimizing Building Placement
If you are at the beginning of your design process and want to figure out the ideal footprint and orientation for a new building on the site:
- Target the Winter Demand: Load the Monthly Sun layer and set it specifically to January. Apply a Threshold filter to isolate and display only the highest-value sensor points (the areas receiving the best solar radiation during the peak heating month).
- Target the Daily Evening Peak: Load the Hourly Sun layer and use the aggregate time function to filter specifically for around the 17:00 - 21:00 slot. Apply the Threshold filter here as well to highlight the surfaces exposed to the late afternoon sun.
- Overlay: Activate Mixer Multi mode to overlay these two datasets.
The Result: The overlapping areas represent the locations where placing your building footprint will maximize solar exposure during critical consumption periods.
Scenario 2: Optimizing Existing Building Surfaces
If you already have a Project Sketch inside your site and want to analyze its specific surfaces to decide where to position window openings (for Solar Heat Gains) and PV panels:
In UrbanMetrix, you can run the exact same analysis described above, but by introducing the Close to Project filter as your first step. This filter allows you to restrict the sensor points analysis exclusively to the immediate proximity of your project's geometries.
Within the Close to Project settings, you can isolate specific parts of the building: Roofs, Facades, Corners.
- Isolate the Surfaces: Activate the Close to Project filter and select whether you want to analyze the roof, the facades, or both.
- Analyze Peak Conditions: Just like in Scenario 1, apply the January Monthly Sun filter and the 17:00 - 21:00 Hourly Sun filter.
- Find the Overlap with Multi-mode: Use the Mixer Multi mode function to overlay the results directly onto your 3D model.
The Result: UrbanMetrix will highlight the exact portions of your facades and roofs where sensor points show the highest radiation during peak demand. This tells you precisely where to open windows to exploit passive solar heat gains in January, or exactly where to place PV panels (whether on the roof or integrated into the facade) to generate electricity right when residents are returning home and consumption is higher.
Source Reference: Consumption behavior baselines and standard local metrics are aligned with the technical specifications of SIA 2024 (Swiss Society of Engineers and Architects).